TENET
and 3 others
boosted

1
#Tag
impressive map-based scrollytelling on tax avoidance within Germany by @fragdenstaat and @zdfmagazin.
3D bars indicating the clustering of hundreds of shell corporations at the same address make the absurdity instantly graspable:
impressive map-based scrollytelling on tax avoidance within Germany by @fragdenstaat and @zdfmagazin.
3D bars indicating the clustering of hundreds of shell corporations at the same address make the absurdity instantly graspable:
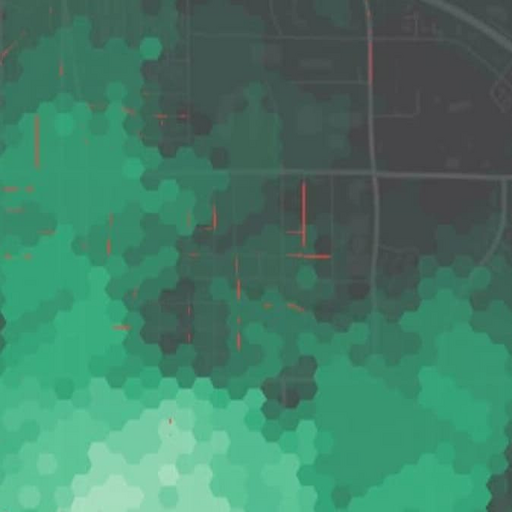
The current iteration of the plugin generates a starter hex grid for you.
The expanded version will support "bring your own hex grid", so you can start with a grid and then continue add more values to it which are then used to build a priority score.
This final step is described more here, in How to Create a Heatmap of Sidewalk Location Priority:
https://mark.stosberg.com/how-to-create-a-heatmap-sidewalk-location-priority/
🧵
Early feedback on the "Sidewalk Location Priority Toolkit" for QGIS is welcome.
Are you interested in something like this? What's helpful to you? Questions?
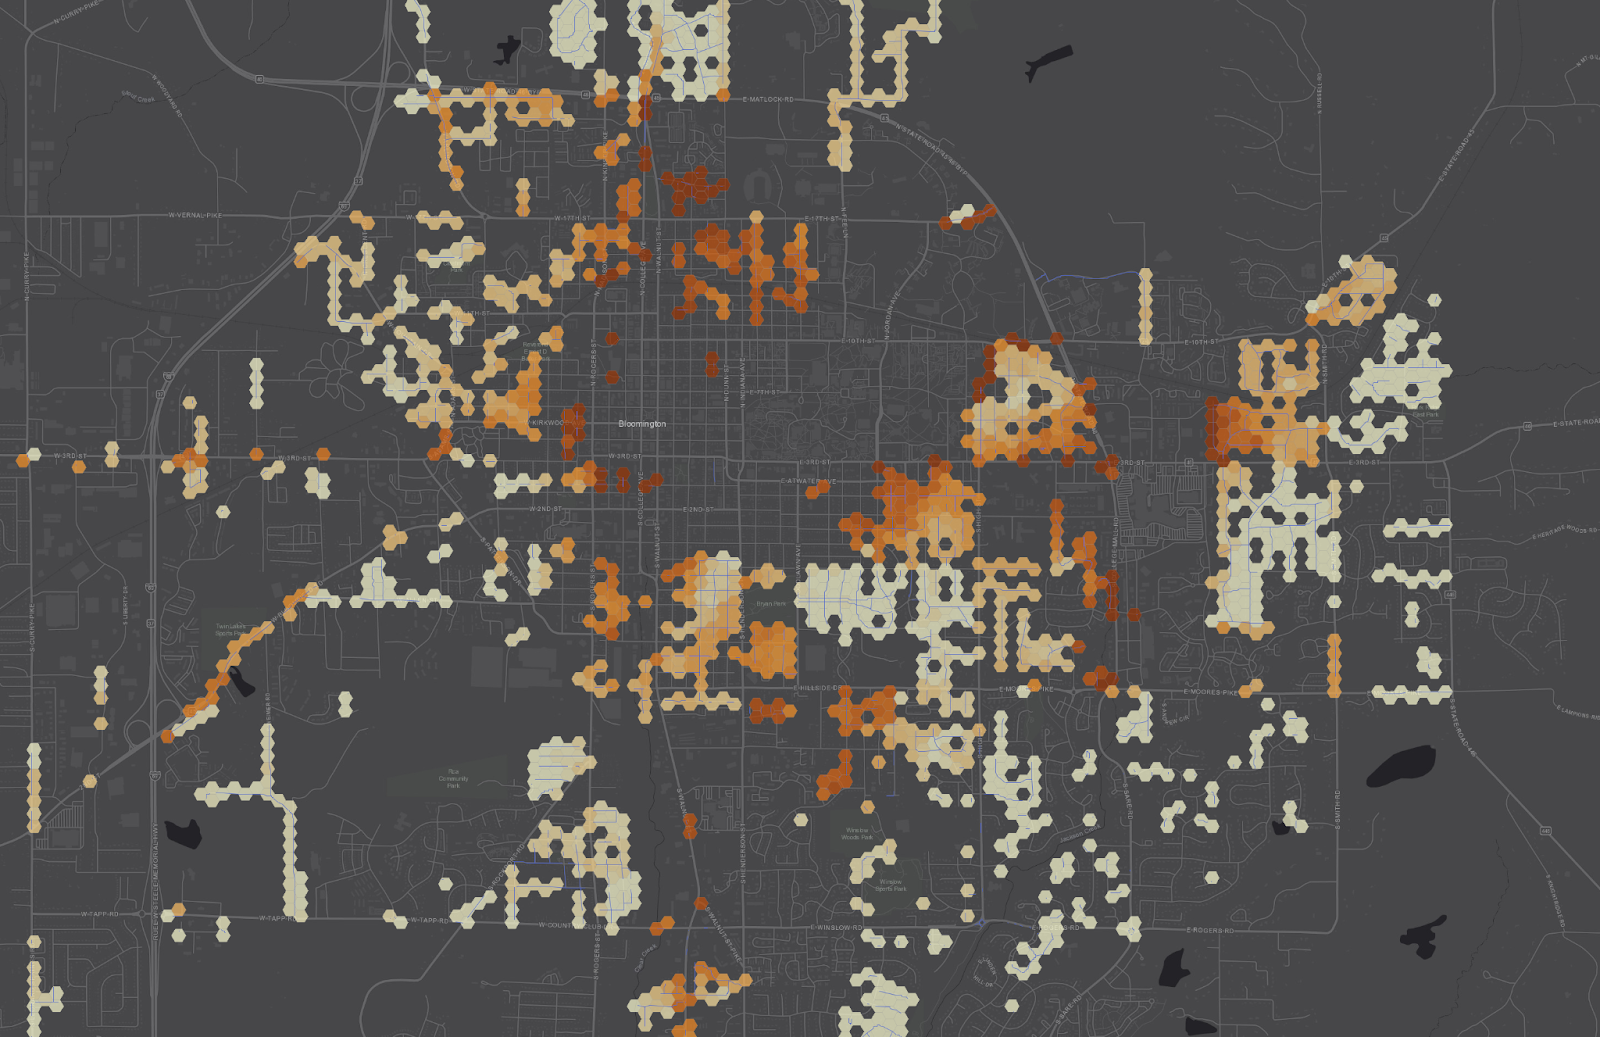
#QGIS supports a "Model builder" that will allow you to chain a selection of these algorithms together with data you have.
At the end of the pipeline, you can give weights to each of the component pieces for a final priority that balances safety, utility and equity in sidewalk planning!
Here's a heatmap of locations with missing sidewalk, shaded based on priority to fund. 🧵
The current iteration of the plugin generates a starter hex grid for you.
The expanded version will support "bring your own hex grid", so you can start with a grid and then continue add more values to it which are then used to build a priority score.
This final step is described more here, in How to Create a Heatmap of Sidewalk Location Priority:
https://mark.stosberg.com/how-to-create-a-heatmap-sidewalk-location-priority/
🧵
The full set of algorithms to be packaged for #QGIS is described here in "Toolkit for Sidewalk Location Priority"
https://mark.stosberg.com/toolkit-for-sidewalk-location-priority/
They include calculating location priority based on:
- "Walk Potential" -- proximity to interesting destinations
- building a Missing sidewalk Map
- line segment data like street width, speed and average traffic volume
- point data like crash locations or traffic column locations.
- Walk proximity to points, like bus stops 🧵
#QGIS supports a "Model builder" that will allow you to chain a selection of these algorithms together with data you have.
At the end of the pipeline, you can give weights to each of the component pieces for a final priority that balances safety, utility and equity in sidewalk planning!
Here's a heatmap of locations with missing sidewalk, shaded based on priority to fund. 🧵
A thread about what's next for my "Walk Potential" #QGIS plugin.
https://plugins.qgis.org/plugins/walk_potential/#plugin-details
Intro video: https://urbanists.video/w/kNht44gXqiN2w95ZhxQRVW
The plan is to expand the scope of this #UrbanPlanning tool into "Sidewalk Priority Toolkit'. It will package several more algorithms that you can then mix and match with your own local data sets to put together a final project priority heatmap to plan sidewalk funding.
Though, the framework may be useful for other kinds of spatial priority as well! 🧵 #mapping
The full set of algorithms to be packaged for #QGIS is described here in "Toolkit for Sidewalk Location Priority"
https://mark.stosberg.com/toolkit-for-sidewalk-location-priority/
They include calculating location priority based on:
- "Walk Potential" -- proximity to interesting destinations
- building a Missing sidewalk Map
- line segment data like street width, speed and average traffic volume
- point data like crash locations or traffic column locations.
- Walk proximity to points, like bus stops 🧵
A thread about what's next for my "Walk Potential" #QGIS plugin.
https://plugins.qgis.org/plugins/walk_potential/#plugin-details
Intro video: https://urbanists.video/w/kNht44gXqiN2w95ZhxQRVW
The plan is to expand the scope of this #UrbanPlanning tool into "Sidewalk Priority Toolkit'. It will package several more algorithms that you can then mix and match with your own local data sets to put together a final project priority heatmap to plan sidewalk funding.
Though, the framework may be useful for other kinds of spatial priority as well! 🧵 #mapping