Discussion
Loading...

Post

  • About
  • Code of conduct
  • Privacy
  • Users
  • Instances
  • About Bonfire
Julia
@joliyea@osna.social  路  activity timestamp 5 days ago

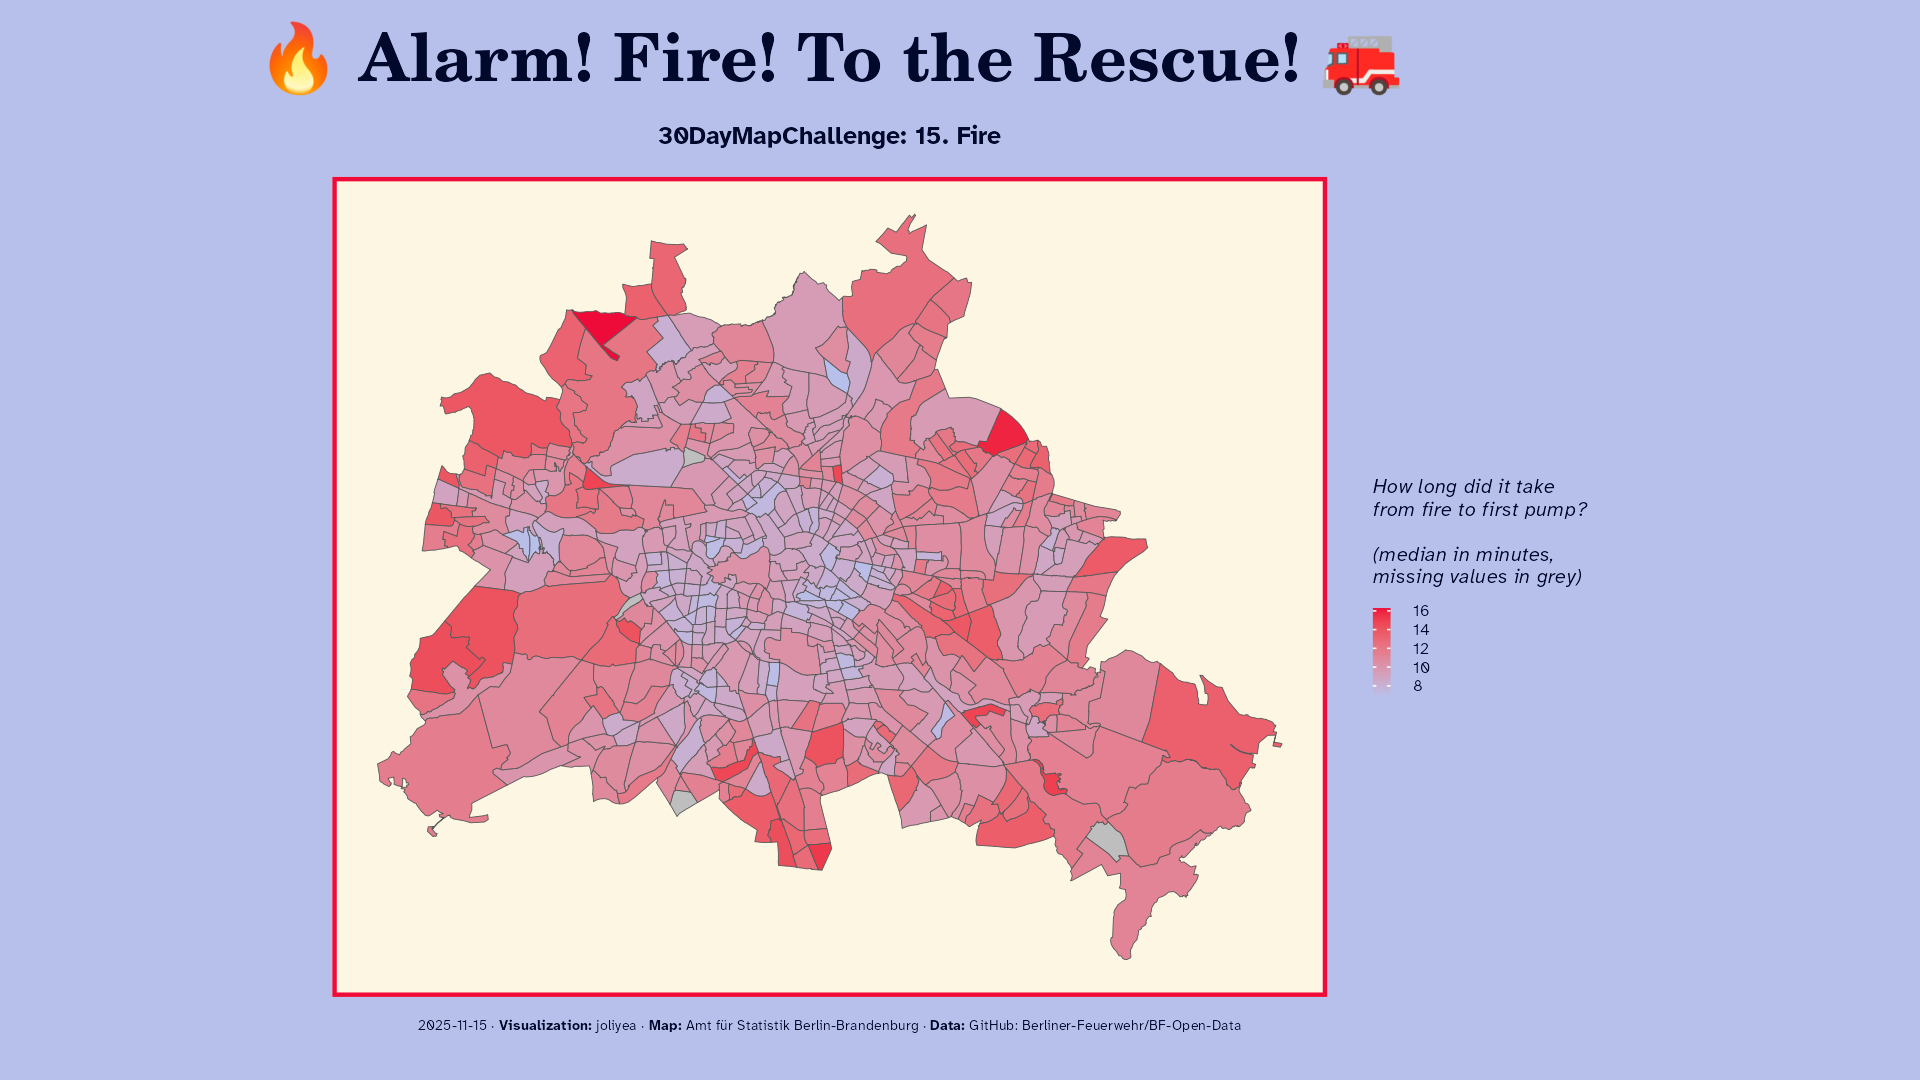
The fire department of Berlin provides pretty interesting data on different metrics (that I unfortunately only understand superficially). They are published on GitHub: https://github.com/Berliner-Feuerwehr/BF-Open-Data/tree/main. This map shows for 2025 until now how long it took from fire to first pump. 馃殥 #30DayMapChallenge

GitHub

GitHub - Berliner-Feuerwehr/BF-Open-Data

Contribute to Berliner-Feuerwehr/BF-Open-Data development by creating an account on GitHub.
Relatively detailed choropleth map of Berlin showing how long it took from fire to the first pump. They were faster in the city center. Title: "Alarm! Fire! To the Rescure!"
  • Copy link
  • Flag this post
  • Block
Log in

Kakapo Social

Kakapo Social: About 路 Code of conduct 路 Privacy 路 Users 路 Instances
Bonfire social 路 1.0.0 no JS en
Automatic federation enabled
  • Explore
  • About
  • Members
  • Code of Conduct
Home
Login