Discussion
Loading...

Post

  • About
  • Code of conduct
  • Privacy
  • Users
  • Instances
  • About Bonfire
Keon Monroe
@kmonroe@mapstodon.space  ·  activity timestamp 5 days ago

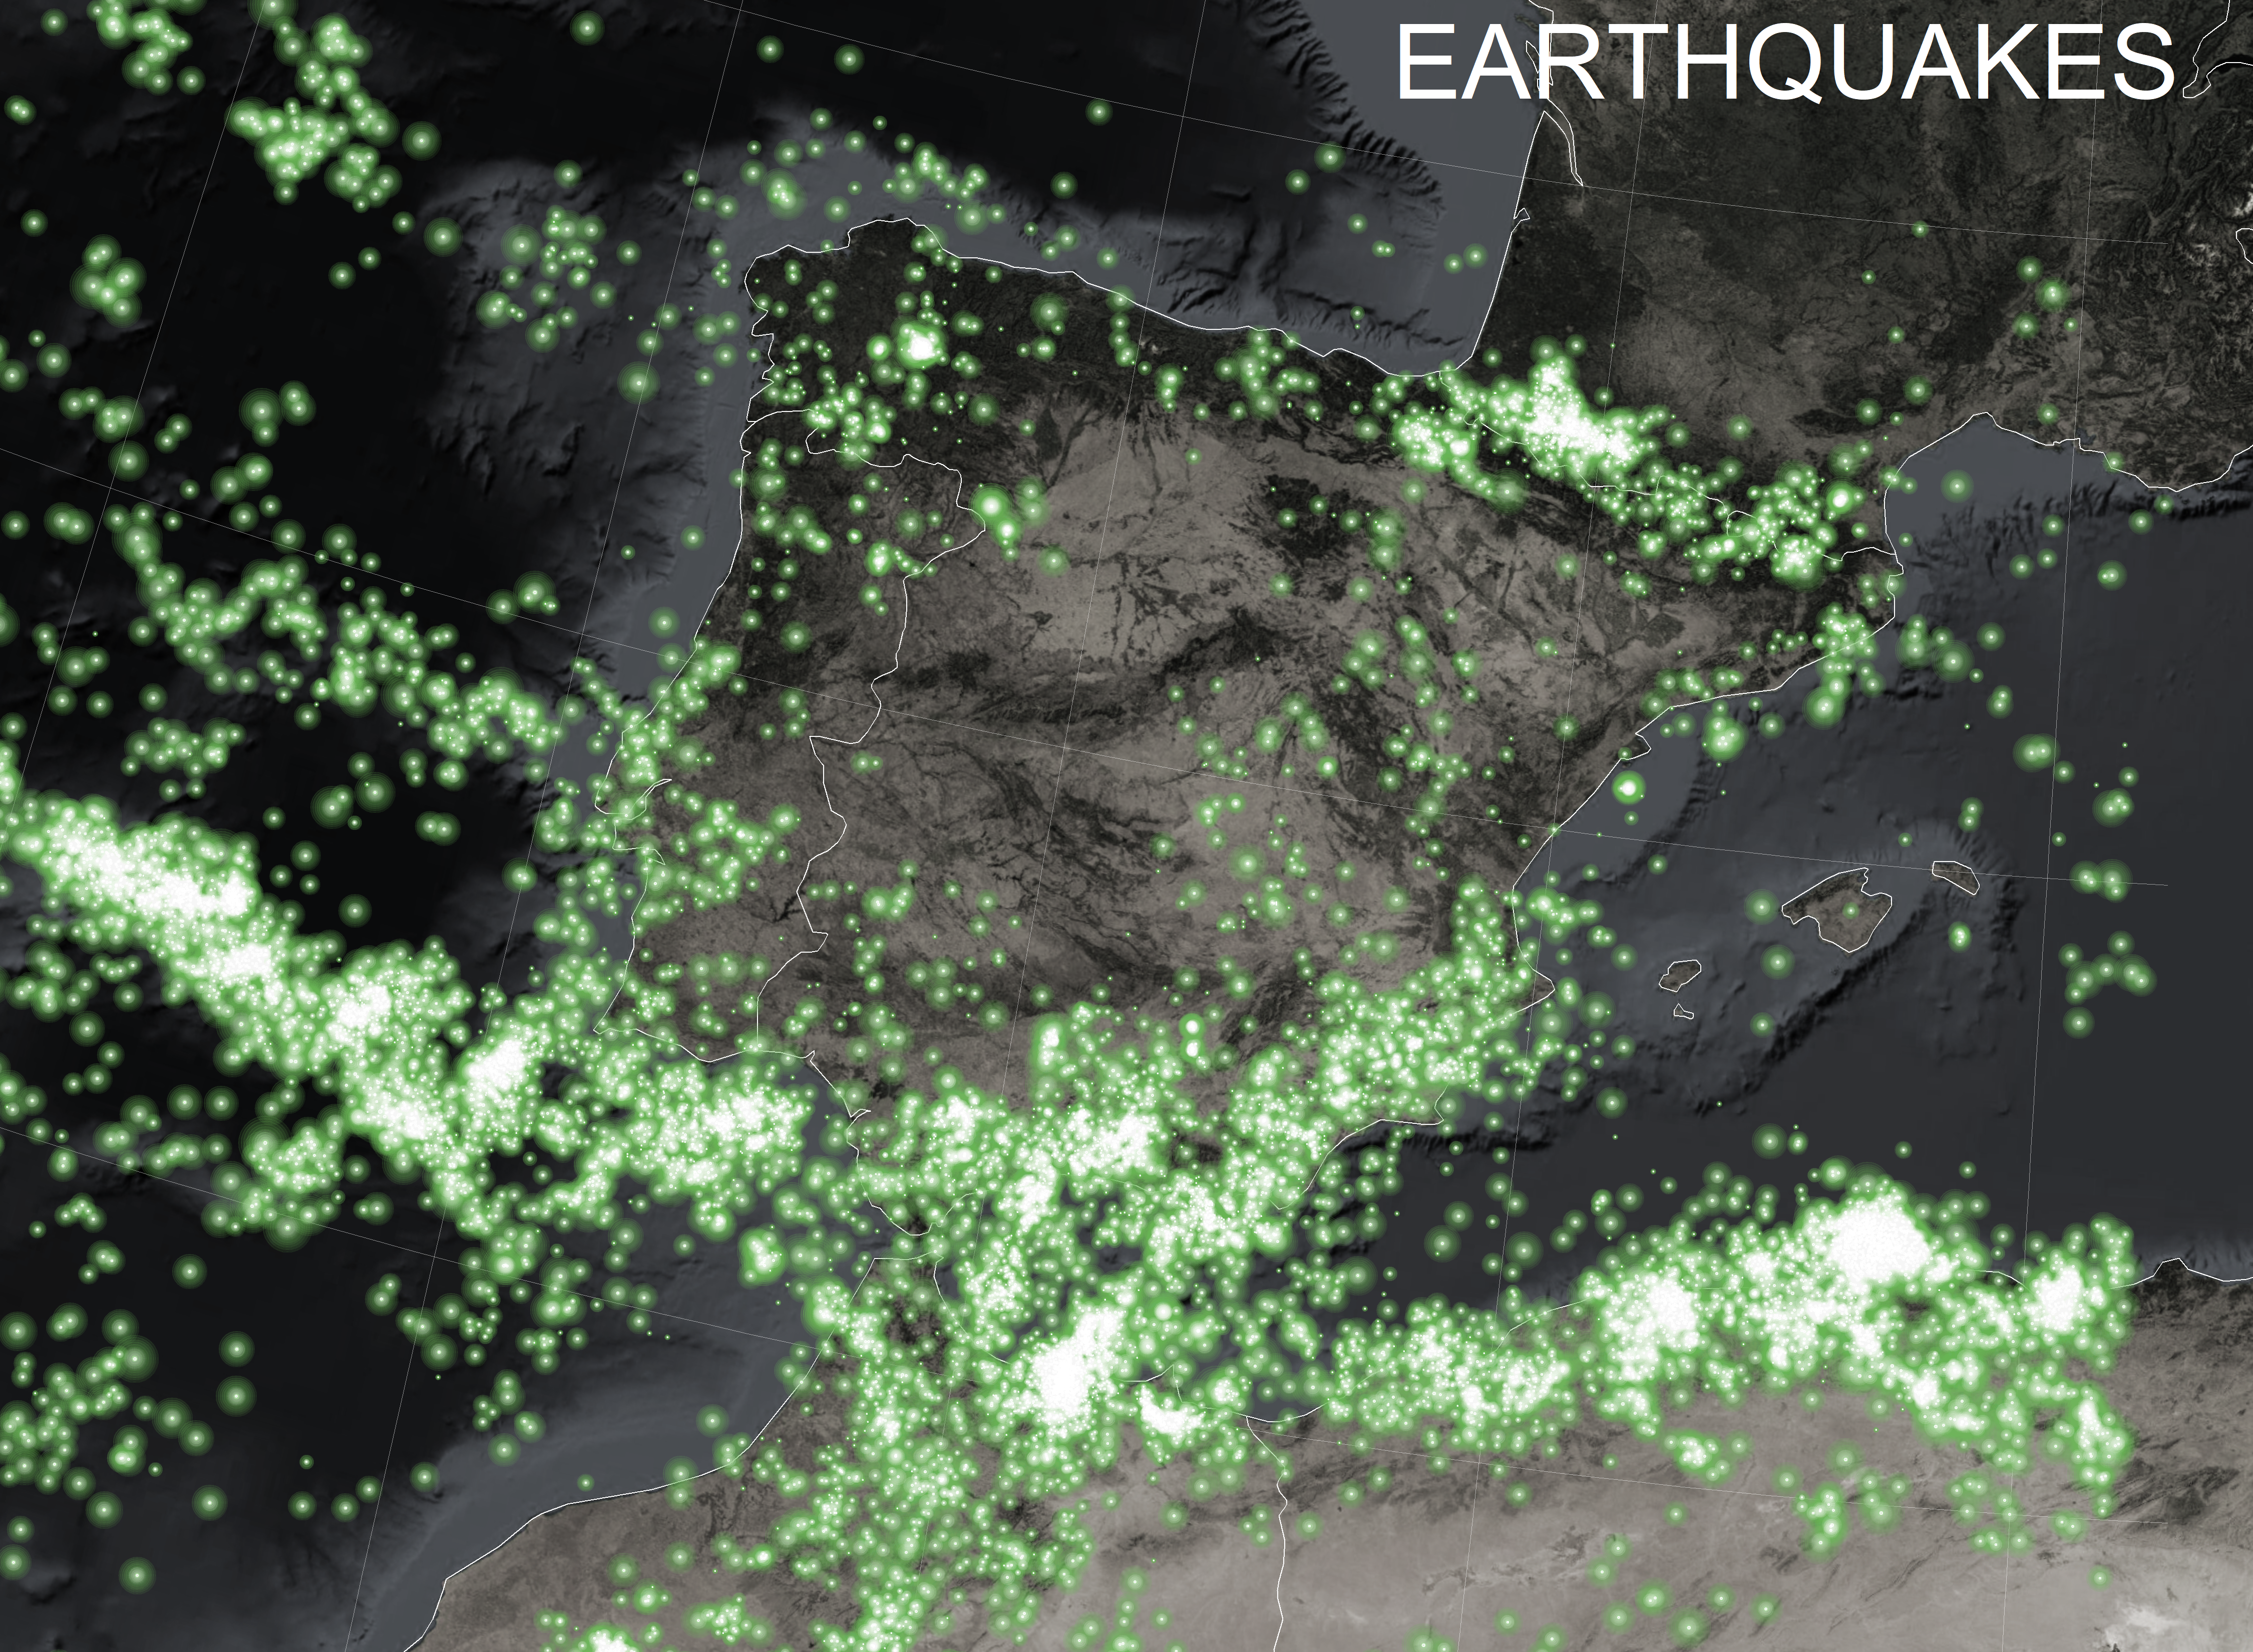
#30DayMapChallenge Day 15. Fire
I redesigned an existing map of US Wildfires with Firefly cartography in mind, and added timeline slider at the bottom. Made w/ ArcGIS JS. See active + historic wildfire incidents on the full map here - shorturl.at/0lqGq
#ArcGIS #Javascript #dataviz

Your browser does not support the video tag.
GIF
GIF
An interactive web map of US wildfire incidents. Styled with Firefly cartography
1
  • Copy link
  • Flag this post
  • Block
Keon Monroe
@kmonroe@mapstodon.space replied  ·  activity timestamp 5 days ago

For more about Firefly cartography, check out John Nelson's post here - https://www.esri.com/arcgis-blog/products/mapping/mapping/steal-this-firefly-style-please
And an implementation in R here - https://dominicroye.github.io/blog/firefly-maps/index.html

Dr Dominic Royé

Firefly cartography

Firefly maps are promoted and described by John Nelson who published a post in 2016 about its characteristics. However, these types of maps are linked to ArcGIS, which has led me to try to recreate them in R.
  • Copy link
  • Flag this comment
  • Block
Log in

Kakapo Social

Kakapo Social: About · Code of conduct · Privacy · Users · Instances
Bonfire social · 1.0.0 no JS en
Automatic federation enabled
  • Explore
  • About
  • Members
  • Code of Conduct
Home
Login